Base your strategic decisions on Business Intelligence

Let your data speak for itself

What we can do to assist you.

Our goal at DTB Analytics (DTB) is to assist you in making decisions and drawing conclusions using Business Intelligence, based on your own data and real-time information. 

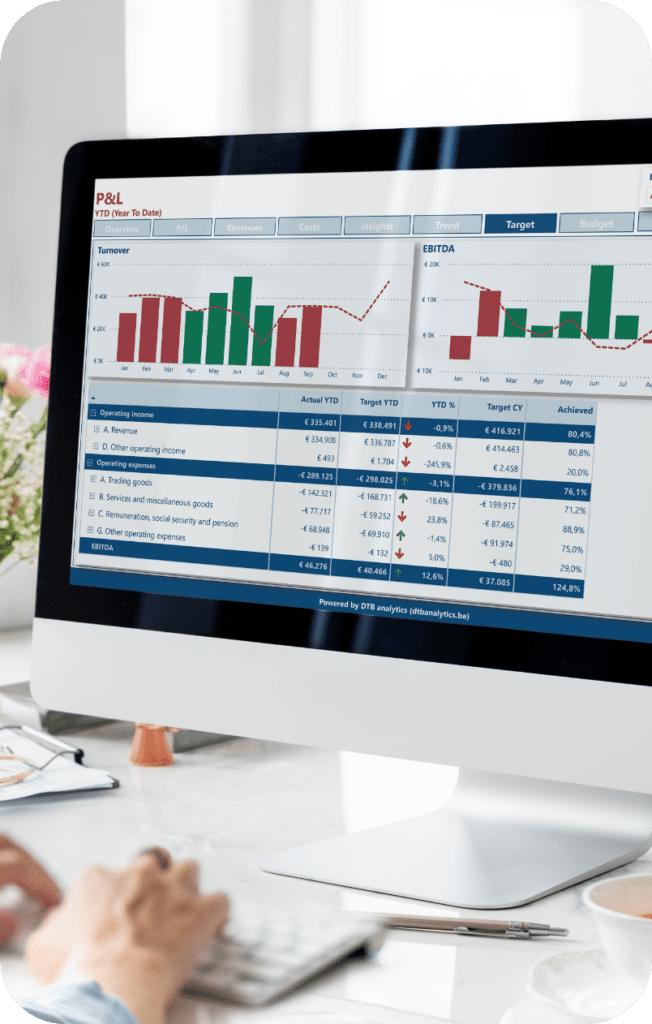
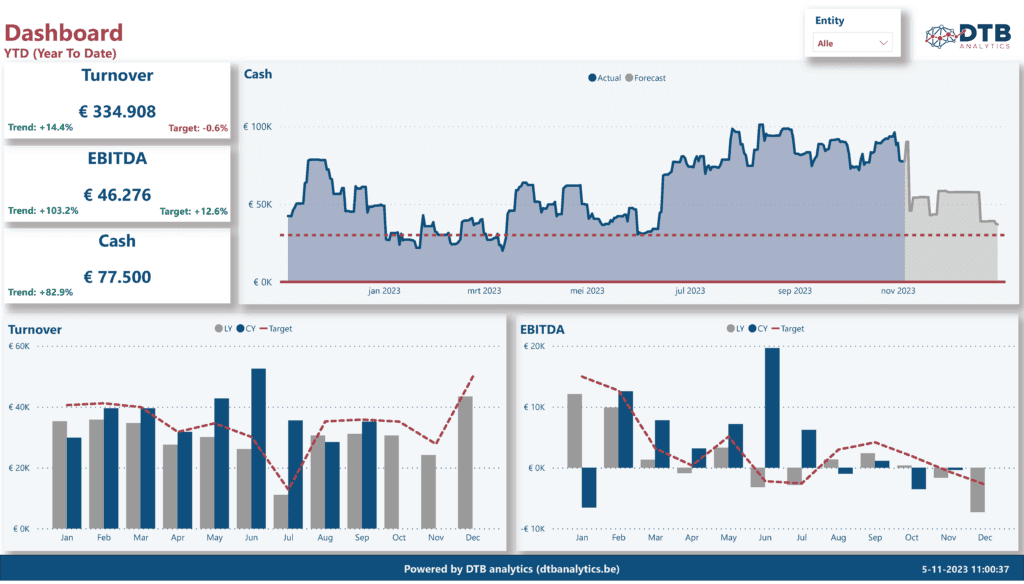
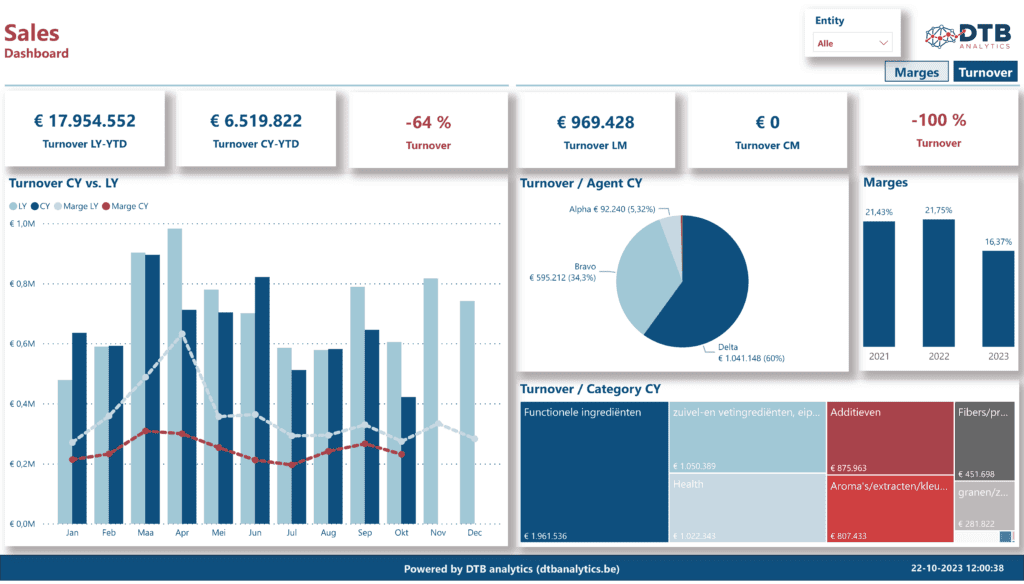
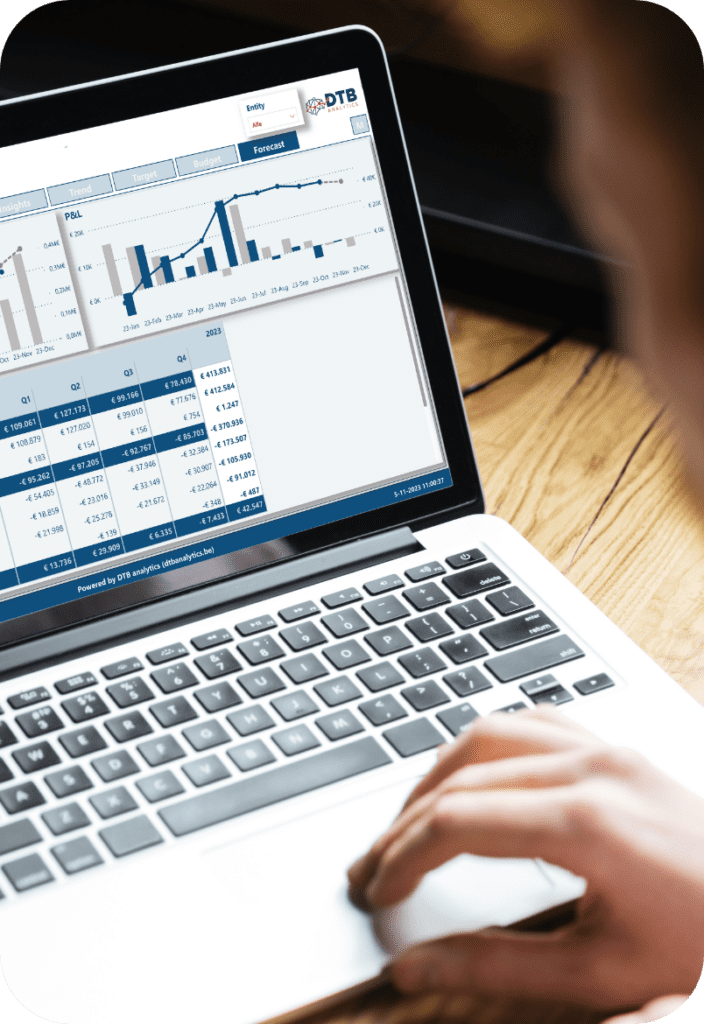
DTB implements automated and customized Power BI reports. Microsoft Power BI is a strong Business Intelligence tool with which data can be converted into clear and visual reports. 

Our expertise lies in various sectors such as HR, Operations, Sales, Finance, Marketing, and Science. However, our data-driven Power BI solutions can be applied to several more sectors. 

We add value by: 

  • Saving you time and money, 
  • Combining your ‘old’ and ‘new’ data‘. Don’t lose any of your data when changing software! 
  • Providing customized dashboards and process automation through our DTB Portal.  

Our services

DTB helps companies select the right data, convert it into valuable and useful information, and visualize it using Microsoft Power BI.

Connect​

Collecting your data from the software you are working with is no longer a problem thanks to the DTB solution. We connect with your different types and sources of data, including various applications, databases, or files such as Excel or CSV. We can also combine your old data from previous software with the data you have just collected. Data from the software can also be linked to customized tables via our portal. All these data sources are then linked to each other and transformed into a visual BI report that’s clear and usable.

Prepare & Model

Your data is cleaned, structured in a predefined model, and customized according to your needs and wishes. This facilitates the consolidation of data and allows you to analyze trends, find similarities, and anticipate future trends. This crucial step saves you a lot of time and increases the efficiency of the analysis and reporting. 

Visualize

Complex data is visualized in an integrated, yet easy-to-understand, visual using the Power BI tool from Microsoft. Customized dashboards display an attractive and comprehensive graphical overview of your management and executive information. 

Automate & Share

DTB provides you with a powerful and automated data analysis solution. Your private space in the DTB portal allows you to easily manage and update your data and dashboards, regardless of the data source or the software to which its connected. Your visual report is always up to date and can be easily shared

Report

The key to success starts with understanding your data. Our data specialists at DTB know your data, how it’s gathered, how it’s used, and how to employ it. They can provide you with written reports that will help you make the right decisions. They make your data speak. 

Educate

Our data specialists at DTB are well acquainted with the tools of Business Intelligence technology and can provide you with on-site training. The purpose is to help you analyze your visuals (at best) in order to define KPIs and trends throughout your organization. You can be educated on how to use our DTB portal to ensure that you take full advantage of all the features it offers. 

Connect

Collecting your data from the software you are working with is no longer a problem thanks to the DTB solution. We connect with your different types and sources of data, including various applications, databases, or files such as Excel or CSV. We can also combine your old data from previous software with the data you have just collected. Data from the software can also be linked to customized tables via our portal. All these data sources are then linked to each other and transformed into a visual BI report that’s clear and usable.

Prepare & Model

Your data is cleaned, structured in a predefined model, and customized according to your needs and wishes. This facilitates the consolidation of data and allows you to analyze trends, find similarities, and anticipate future trends. This crucial step saves you a lot of time and increases the efficiency of the analysis and reporting. 

Visualize

Complex data is visualized in an integrated, yet easy-to-understand, visual using the Power BI tool from Microsoft. Customized dashboards display an attractive and comprehensive graphical overview of your management and executive information. 

Automate & Share

DTB provides you with a powerful and automated data analysis solution. Your private space in the DTB portal allows you to easily manage and update your data and dashboards, regardless of the data source or the software to which its connected. Your visual report is always up to date and can be easily shared

Report

The key to success starts with understanding your data. Our data specialists at DTB know your data, how it’s gathered, how it’s used, and how to employ it. They can provide you with written reports that will help you make the right decisions. They make your data speak. 

Educate

Our data specialists at DTB are well acquainted with the tools of Business Intelligence technology and can provide you with on-site training. The purpose is to help you analyze your visuals (at best) in order to define KPIs and trends throughout your organization. You can be educated on how to use our DTB portal to ensure that you take full advantage of all the features it offers. 

The process

We live in a fast-paced world that is becoming more and more data-driven. We have an infinite amount of data to work with. Do you want to be part of this world? Fasten your seat belt, because we can take you far with our analysis! 

What are the various steps we follow to carry out the analysis? We start by connecting to your data and retrieving it as described above. Following that, the data is prepared, modeled, and analyzedThe final step of the analysis process is the visualization and graphical illustration, which is completed using Microsoft’s Power BI tool. On request, written reports and training can also be provided. All documents will be manageable through your own private space in the DTB portal, the real-time data will be easily refreshed and the visuals will be updated. 

What makes us unique?

Customized & Reactive dashboards

Our reports and BI dashboards are fully customized. They are designed according to the needs, vision, and brand identity of your company. Besides that, the graphics and visuals are fully reactive and easy to manipulate.  

Hybrid development

DTB projects are developed, analyzed, and delivered within very reasonable timeframes. Delivery times are shortened even further by using various advanced Microsoft tools for basic graphical visualization. We highly value both your and our time, so don’t worry about that!  

Data import & export

By using the DTB solution you can connect and import various types of data from different sources. Our data tables can be created as custom “paginated reports” using Power BI Report Builder and easily exported to Excel files. These reports can be published on the web, exported to PowerPoint/PDF, and even integrated into your application. You’ll never have to worry about creating your own reports or visualizations again! 

Add-ons

Various add-ons can be applied and used on your BI reports prepared by DTB: from bookmarks to subscriptions, you can also receive daily reports by e-mail when specific KPIs or quotas are reached by setting triggers and alerts. In addition, all these reports and dashboards can be accessed at any time and from any device (mobile, desktop or tablet). 

Our portal

You can easily track work, manage reports, update your data or visuals, and plan the next steps by using your private space on the DTB portaland this via the desktop or app. By working closely together we deliver what is best for you! 

DTB Tables

DTB tables are a feature that allows you to dynamically create and customise new data tables to suit your needs, and then connect them to existing data from any other source. Your data can be manipulated, adjusted and adapted to your demands.

What our customers say about us

Ready to take the next step?

Are you a data-driven person who is ready to take the next step? DTB ensures that you get the most out of our business services. Get in contact with us now and get ready to be amazed.